
SEO Keywords Targeted


Analytics That Drive Smarter Delivery
Every delivery tells a story—of timing, accuracy, cost, and customer satisfaction. But without the right analytics, you’re left guessing. That’s why TrackOps, built by Mondo Cloud Solutions in London, Ontario, offers a fully integrated Business Analytics module that turns your last mile data into powerful insights.
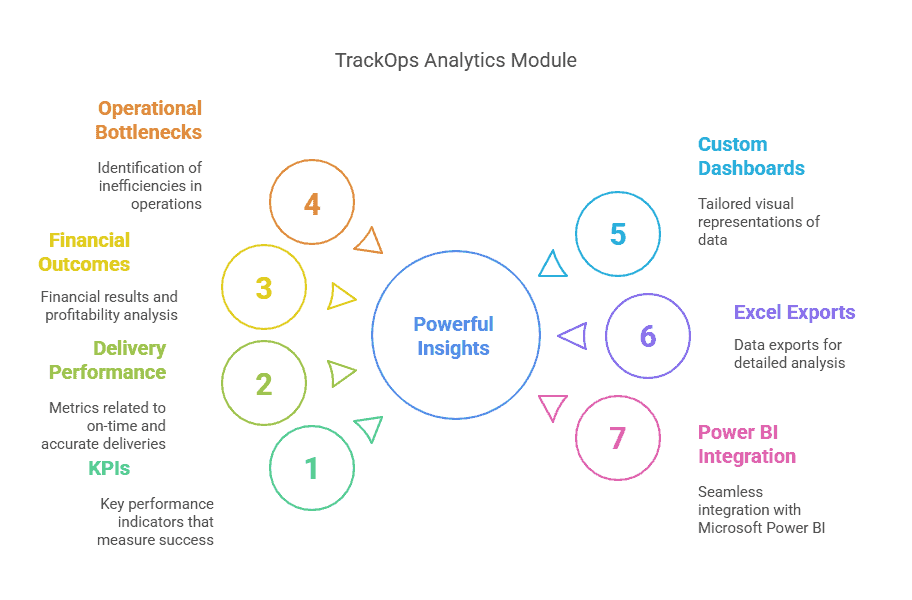
For logistics companies and white glove carriers across Canada and the U.S., this module provides real-time visibility into KPIs, delivery performance, financial outcomes, and operational bottlenecks—through custom dashboards, Excel exports, and deep Power BI integration.

What Is TrackOps Business Analytics?

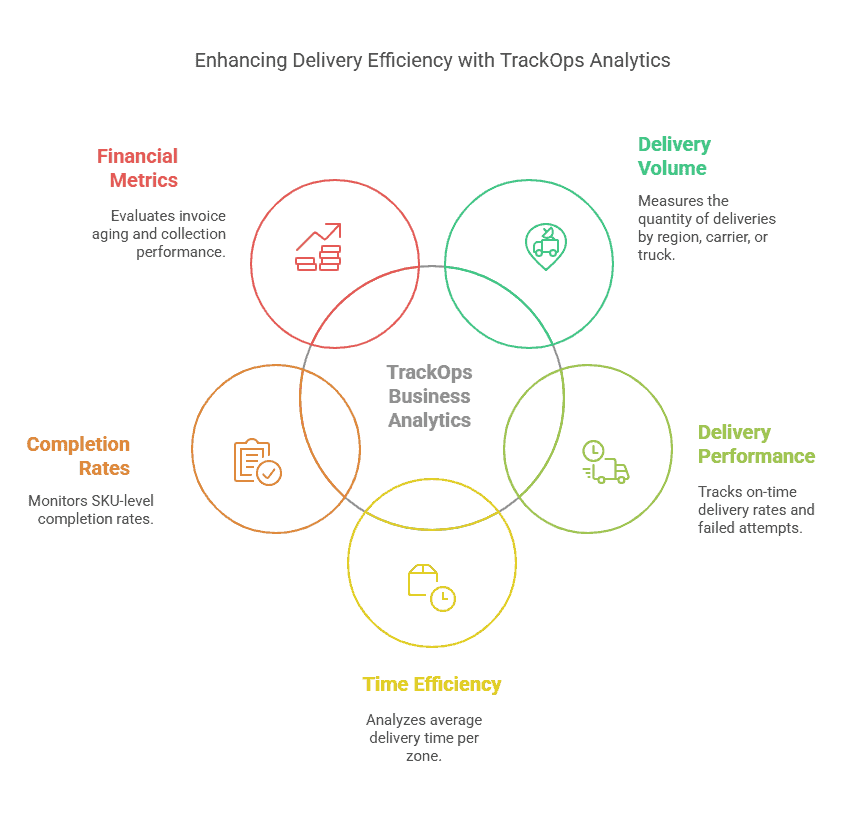
TrackOps Business Analytics consolidates data from across your delivery network and visualizes it in actionable formats. You can track:
Delivery volume by region, carrier, or truck
On-time delivery rates
Failed or reattempted deliveries
Average delivery time per zone
SKU-level completion rates
Invoice aging and collection performance
Customer feedback trends
Inventory movement patterns
The dashboards are designed for owners, managers, dispatchers, and even retail partners—each getting the view they need.
Reporting Tools Included:
Power BI Dashboards
Interactive, visual insights directly connected to your TrackOps data.
Excel Extracts
Custom reports for billing, performance, inventory, and completion—scheduled or ad hoc.
PDF Reports
Ready-to-share summaries, daily updates, or presentations.
Automated Email Delivery
Send snapshots to stakeholders on a daily, weekly, or monthly basis.
Real-Time Dashboards for Every Role:
Operations Manager: View on-time rates, failed deliveries, and route delays
Warehouse Team: See pick list accuracy, storage durations, and SKU flows
Finance Team: Monitor open invoices, disputes, and daily revenue
Retailers: Access branded performance dashboards and customer feedback
Deep Integration with Other TrackOps Modules
This module draws on data from every other service:
Order Integration: Track order intake volume, success rate, and source
TMS Integration: Analyze routing accuracy, reschedules, and driver performance
Status Updates: View delivery lifecycle stats, completion ratios, and exception rates
Billing Automation: Monitor invoice generation timelines and revenue flow
Cash App & Dispute Management: Analyze short-pay trends and dispute resolution times
Inventory & SKU Tracking: Report on warehouse efficiency and SKU handling times
Custom Reports: Generate insights on report frequency, user access, and accuracy
How It Works – Step by Step
Data Aggregation TrackOps continuously collects data across modules—scans, delivery statuses, billing events, survey feedback, etc.
Data Modeling Our system transforms raw data into structured metrics and ratios that can be used across dashboards and reports.
Visualization You can access:
– Web dashboards (Power BI)
– On-demand Excel exports
– PDF summaries
Alerts & Trends Set thresholds for alerts (e.g., failed delivery rate > 10%) and TrackOps will notify your team via email or in-app prompts.
Real-World Case:
A white glove delivery company based in London, Ontario needed daily pick lists for its 6 warehouses. TrackOps delivered:
100% accuracy in staging
2+ hours/day saved in planning
Survey feedback now received for 85% of deliveries
Billing cycle linked directly to completed reports
Use Case Example:
A regional last mile provider in Ontario used to analyze delivery trends manually at the end of each month. After activating TrackOps Analytics:
KPI dashboards updated every hour
Warehouse productivity increased by 22%
Customer reattempt rates were reduced by identifying failure zones
Daily billing dashboards improved revenue tracking by 35%
Benefits of Business Analytics:
✔ Data-driven operations
✔ Faster decisions backed by insights
✔ Reduce failed deliveries and delays
✔ Improve billing, collections, and cash flow
✔ Empower every department with the right data
✔ Gain transparency for internal and external partners
Office 365 + Analytics: Perfect Pair
TrackOps dashboards integrate with Microsoft 365 tools:
Share Power BI reports via Teams
Archive delivery trends in SharePoint
Email alerts through Outlook
Embed insights into executive presentations
Conclusion:
In a data-rich industry like last mile logistics, your success depends not on how much data you have—but on how well you use it. TrackOps Business Analytics helps you make sense of every route, every invoice, every order.
For carriers across Canada and the U.S., especially in London, Ontario, this module provides the insights needed to optimize, scale, and lead.
Because in logistics, clarity is power—and with TrackOps, you see everything.
Over 1.3M orders & invoices processed
trusted by 50+ global partners for 12+ years.